01
Compare multiple dimensions
A profitable company can still be expensive, highly leveraged or slowing. The report keeps those dimensions separate before summarizing them.




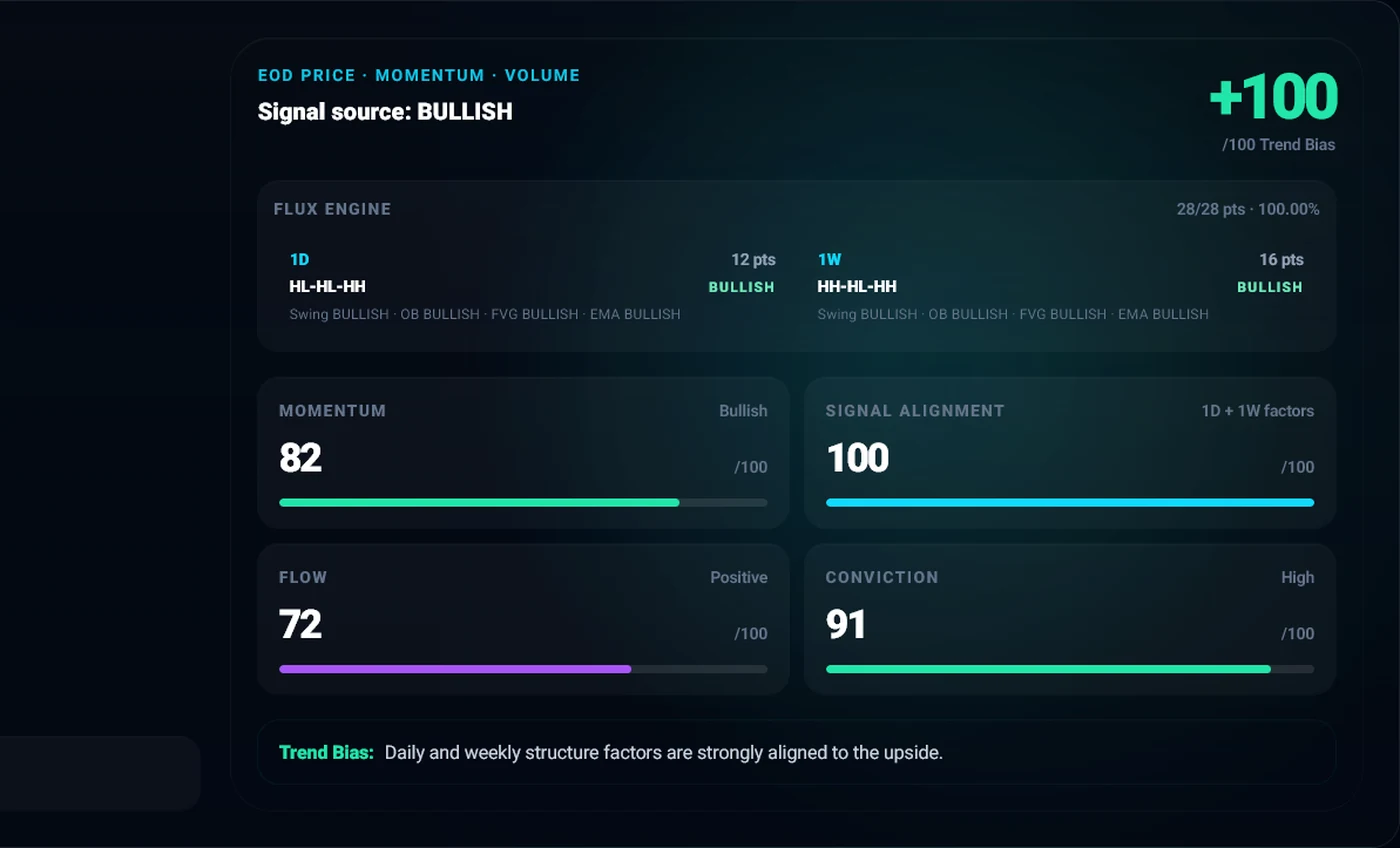 Flux EngineTrend, momentum and volume alignment.
 Pattern ReconChart and candlestick structures in context.
 Wyckoff ReconAccumulation and distribution phase mapping.
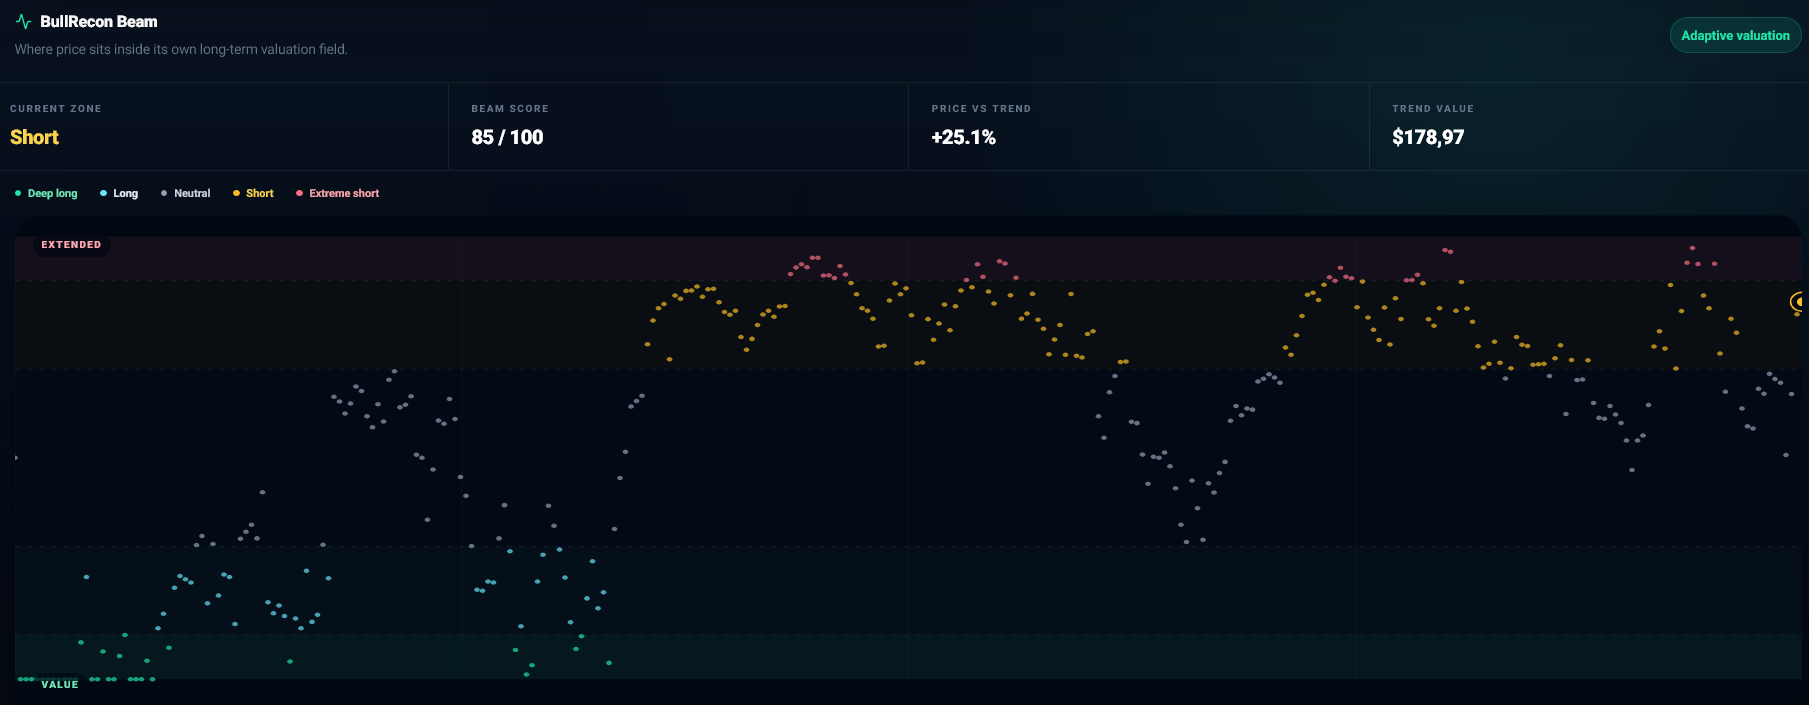 BullRecon BeamRelative price position across an adaptive field.
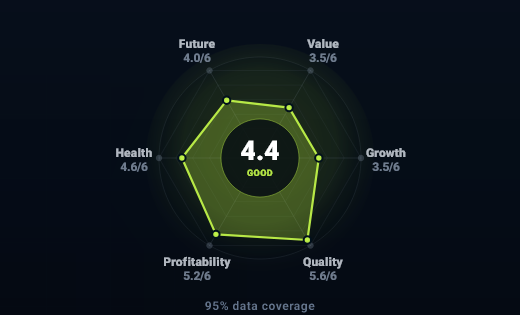 Company RadarSix dimensions of business quality.
 Valuation & EntryFair value, support and long-term bands.
 Financials & Cash FlowRevenue, profit and cash generation.
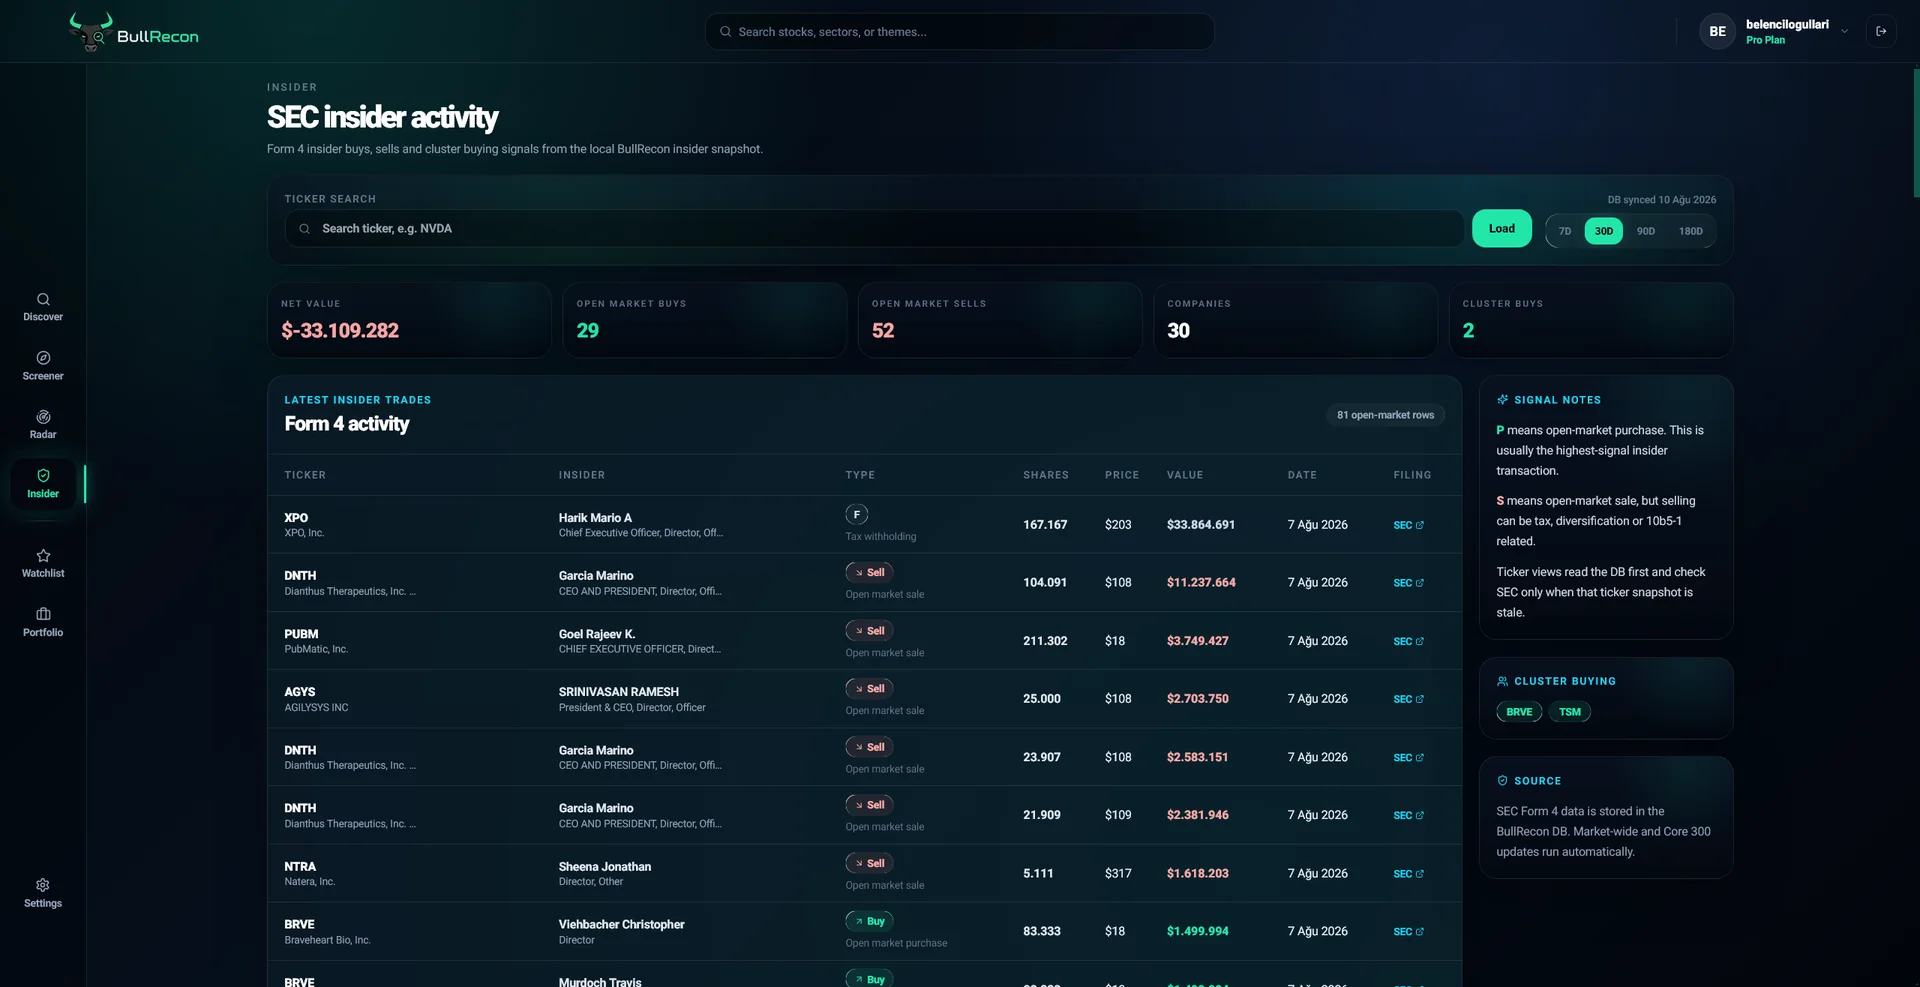 Earnings & OwnershipReports, insiders and institutional activity.
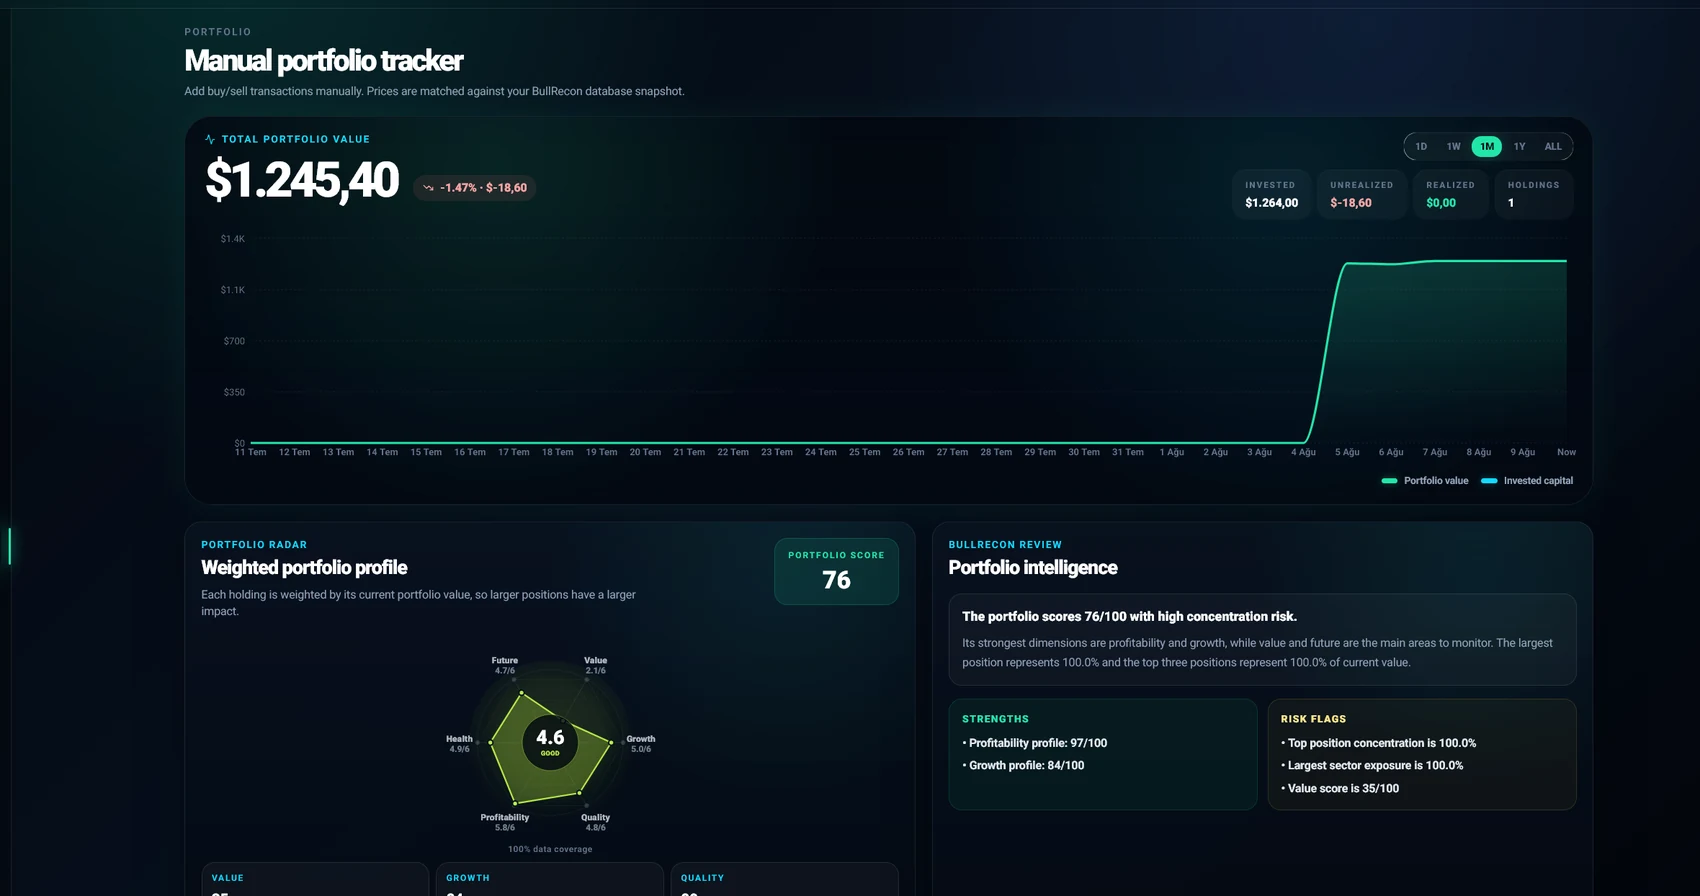 Market FlowCross-asset capital rotation and market regime.
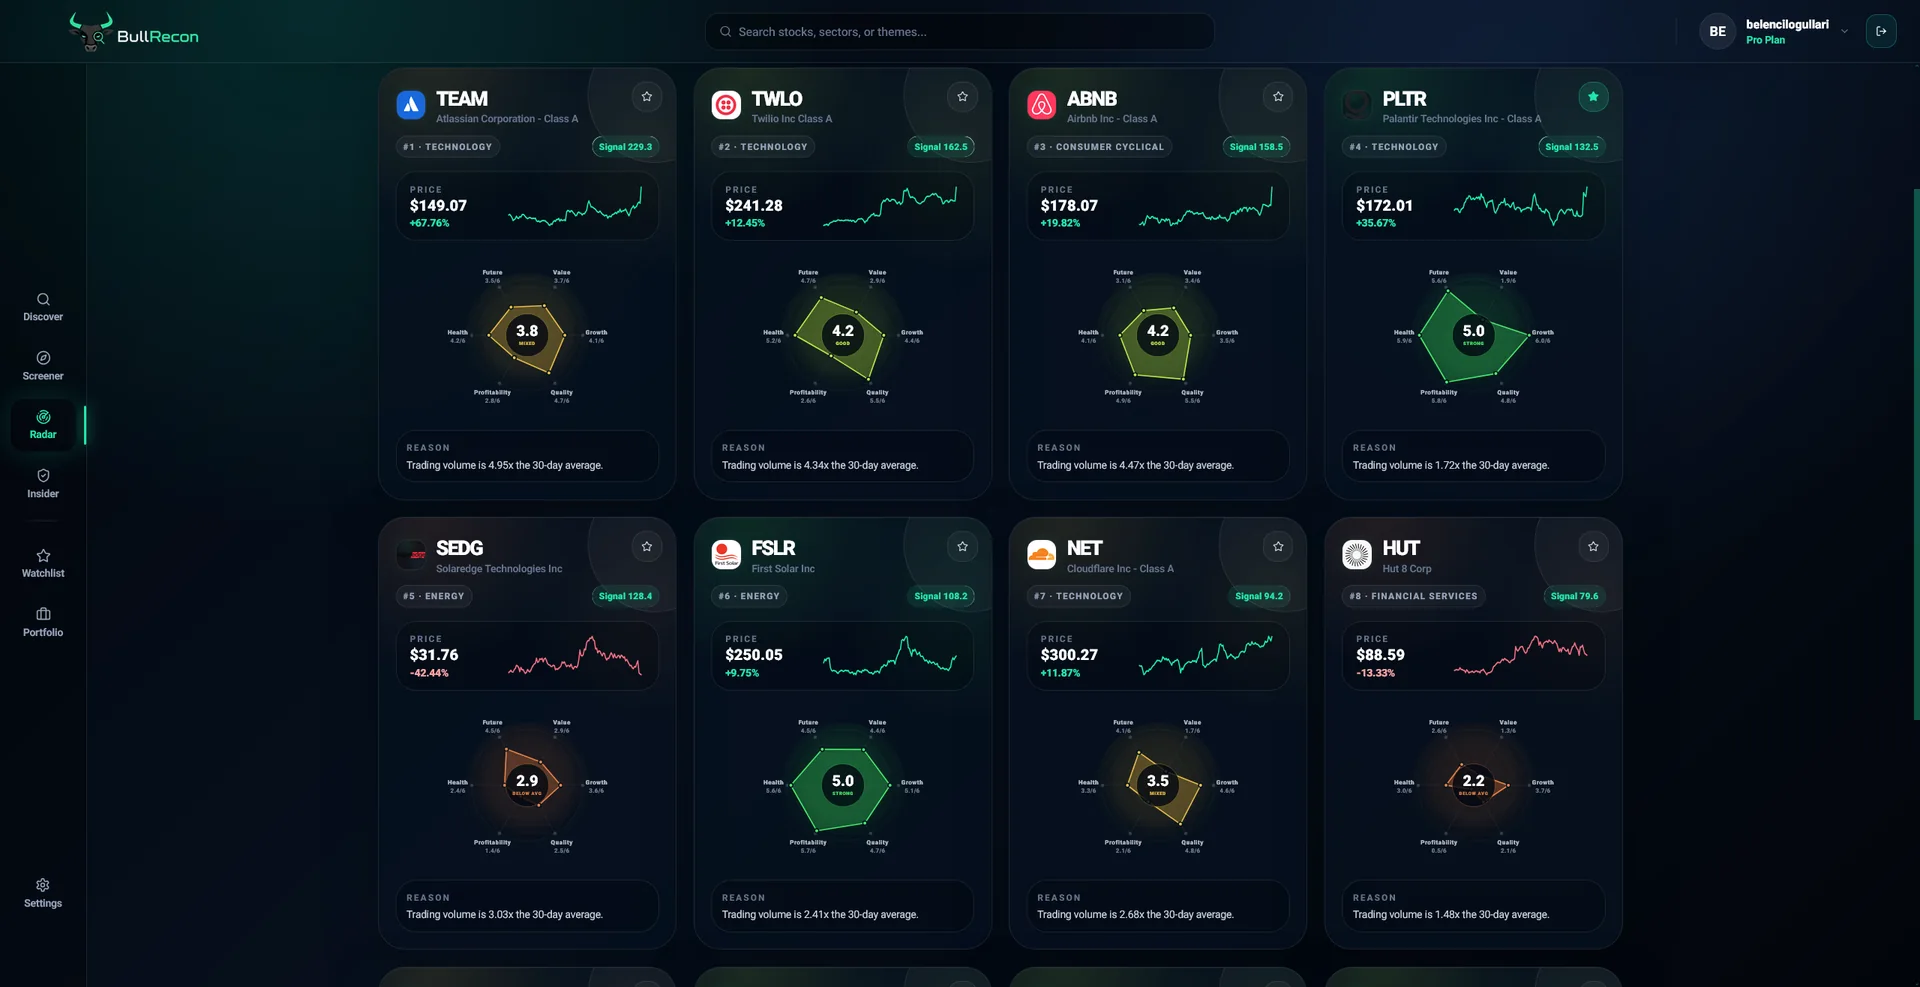 Daily RadarRanked opportunity lists refreshed from current market data.
 Stock ScreenerBuild a focused universe with presets and advanced filters.Stock DirectoryExplore supported US-listed companies and public reports.
 Analyst IntelligenceFollow source-verified calls and measured track records.Portfolio IntelligenceConnect performance, holdings and company context.
BullRecon turns financial statements, valuation models, earnings and ownership filings into a visual company report while keeping the underlying limits and reporting dates visible.
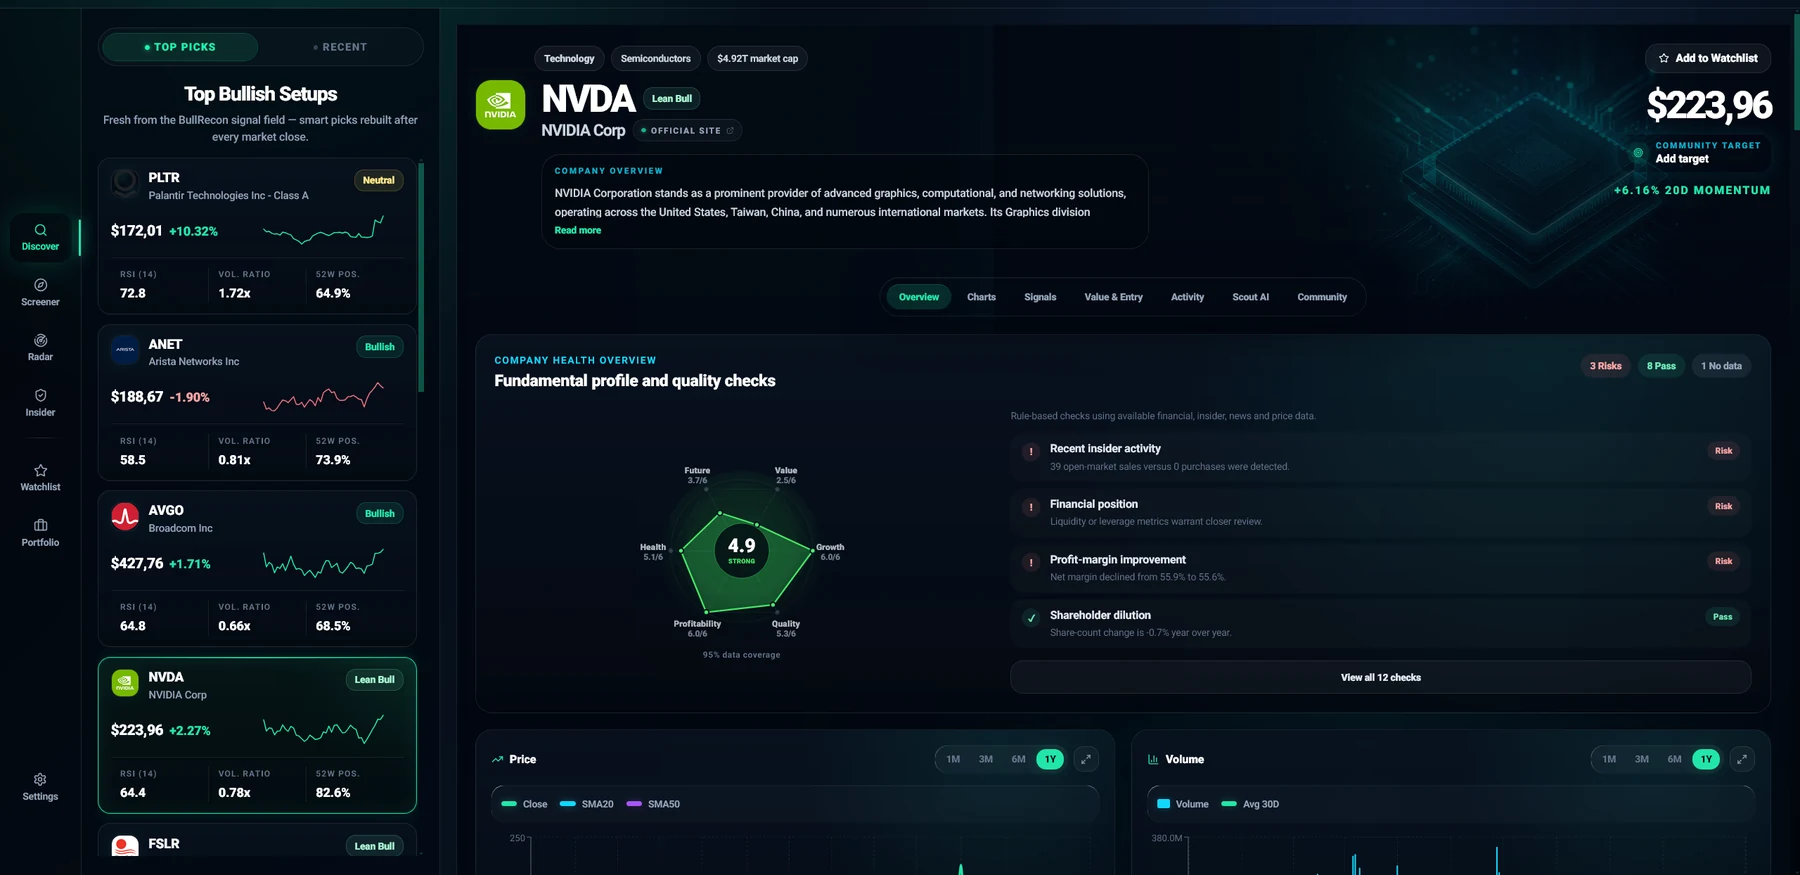
Company Radar organizes available financial evidence into value, growth, quality, profitability, health and future dimensions. The combined score is a research summary whose components remain visible for inspection.
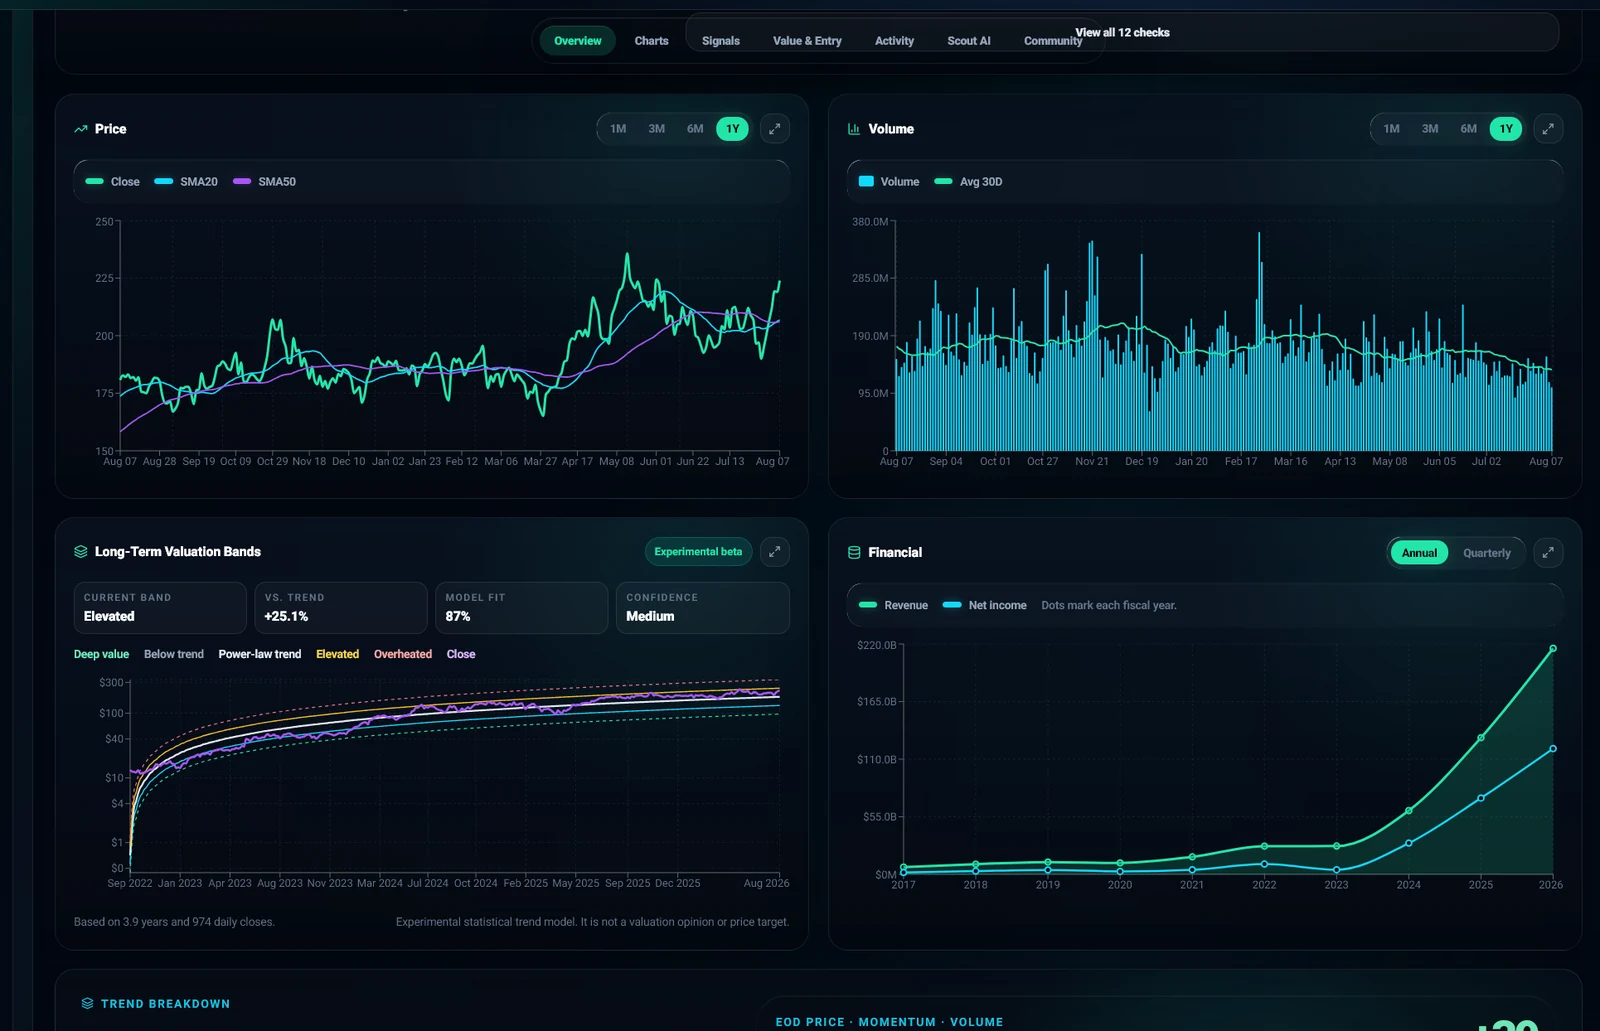
The valuation profile combines model-derived fair value with long-term valuation bands and technical support context. Data confidence is shown so incomplete inputs are not presented with false precision.
Revenue, profitability, operating cash flow, capital expenditure and free cash flow are displayed as trends rather than isolated numbers. This makes it easier to distinguish operating improvement from heavy reinvestment or weakening cash conversion.
Earnings history, SEC Form 4 insider transactions and reported institutional holdings sit inside the same company report. Each dataset retains its own reporting cadence and source context.
A profitable company can still be expensive, highly leveraged or slowing. The report keeps those dimensions separate before summarizing them.
Prices may update daily while company filings, insider activity and institutional holdings follow different schedules.
Missing or incomplete inputs should reduce certainty, not quietly become neutral or favorable evidence.
No. It is a normalized research summary across six company dimensions and should be read together with the visible component scores and source data.
No. Fair value is a model estimate based on available inputs and assumptions. BullRecon shows a range because valuation is not a precise forecast.
Institutional ownership is based on periodic public filings and is not real-time trading activity. The relevant reporting period is shown in the product.
Capital expenditure may be increasing. BullRecon displays operating cash flow, investment spending and free cash flow together so that reinvestment can be evaluated in context.