



Try Free
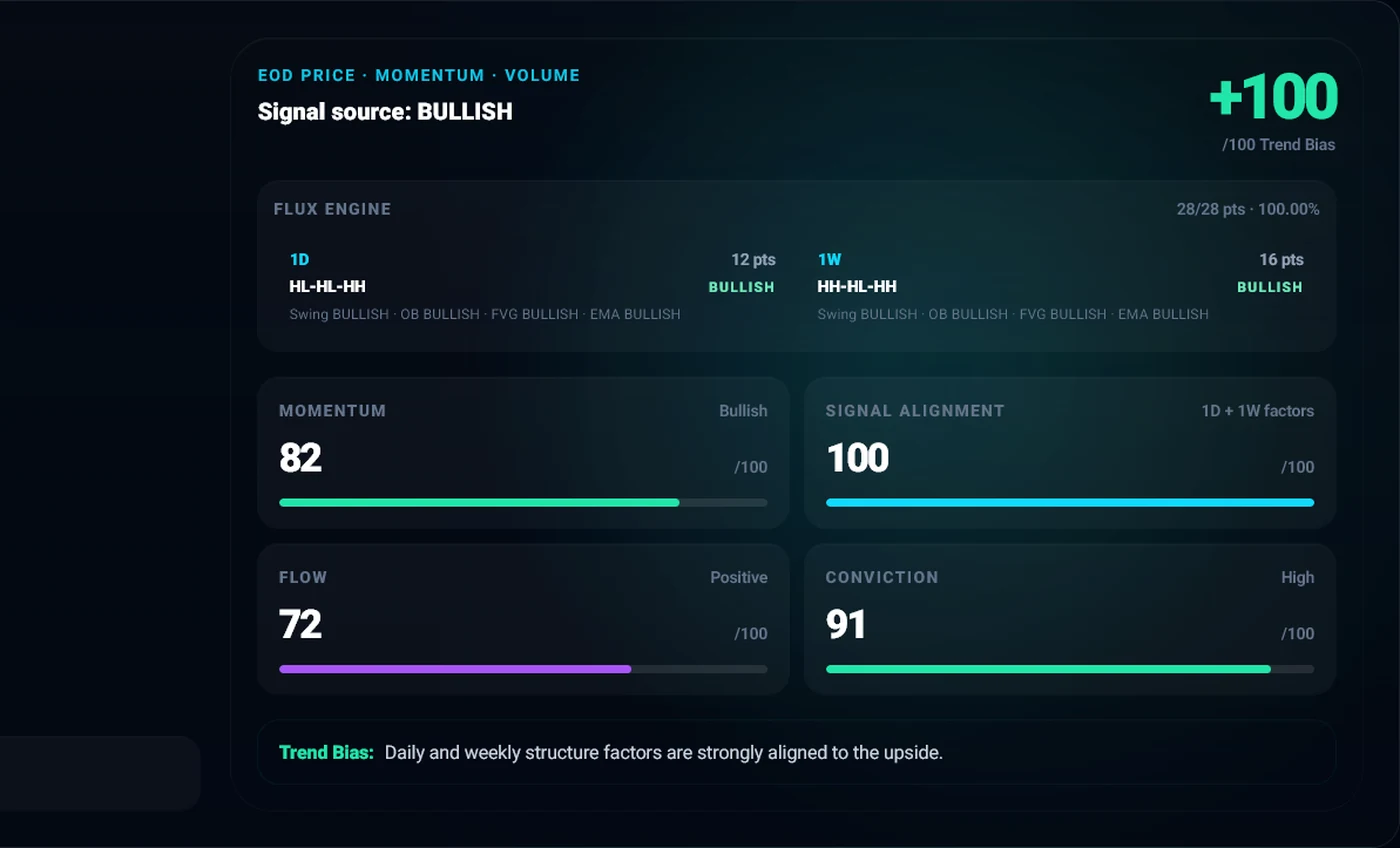 Flux EngineTrend, momentum and volume alignment.
 Pattern ReconChart and candlestick structures in context.
 Wyckoff ReconAccumulation and distribution phase mapping.
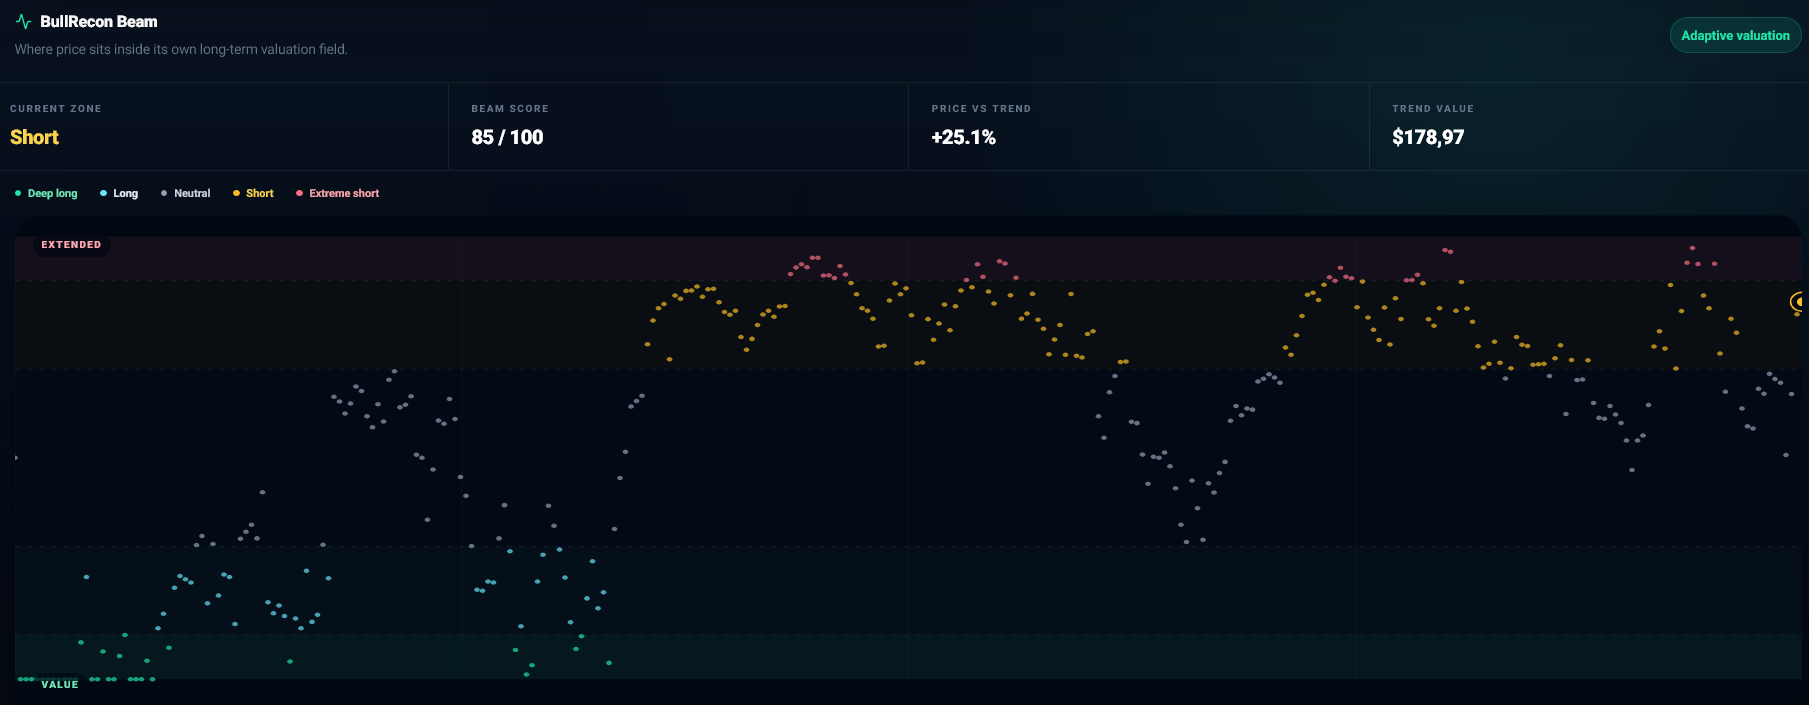 BullRecon BeamRelative price position across an adaptive field.
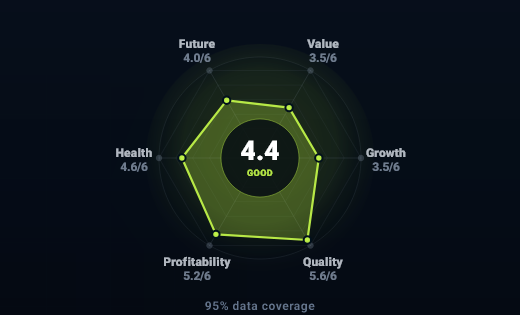 Company RadarSix dimensions of business quality.
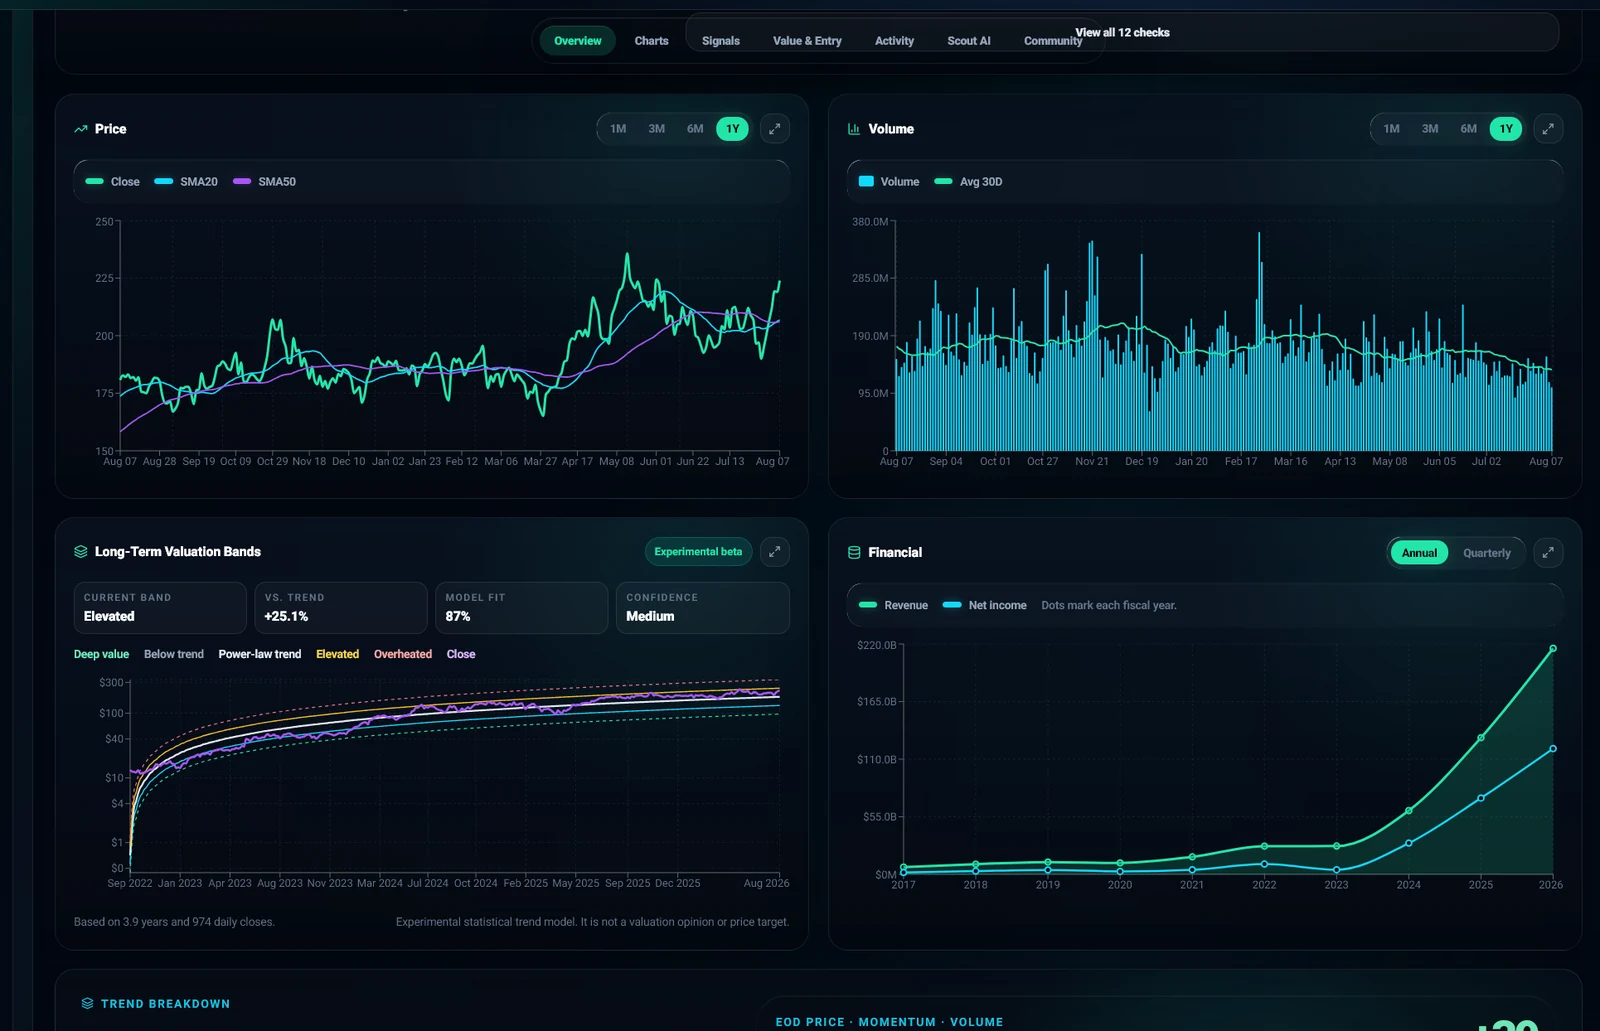
 Valuation & EntryFair value, support and long-term bands.
 Financials & Cash FlowRevenue, profit and cash generation.
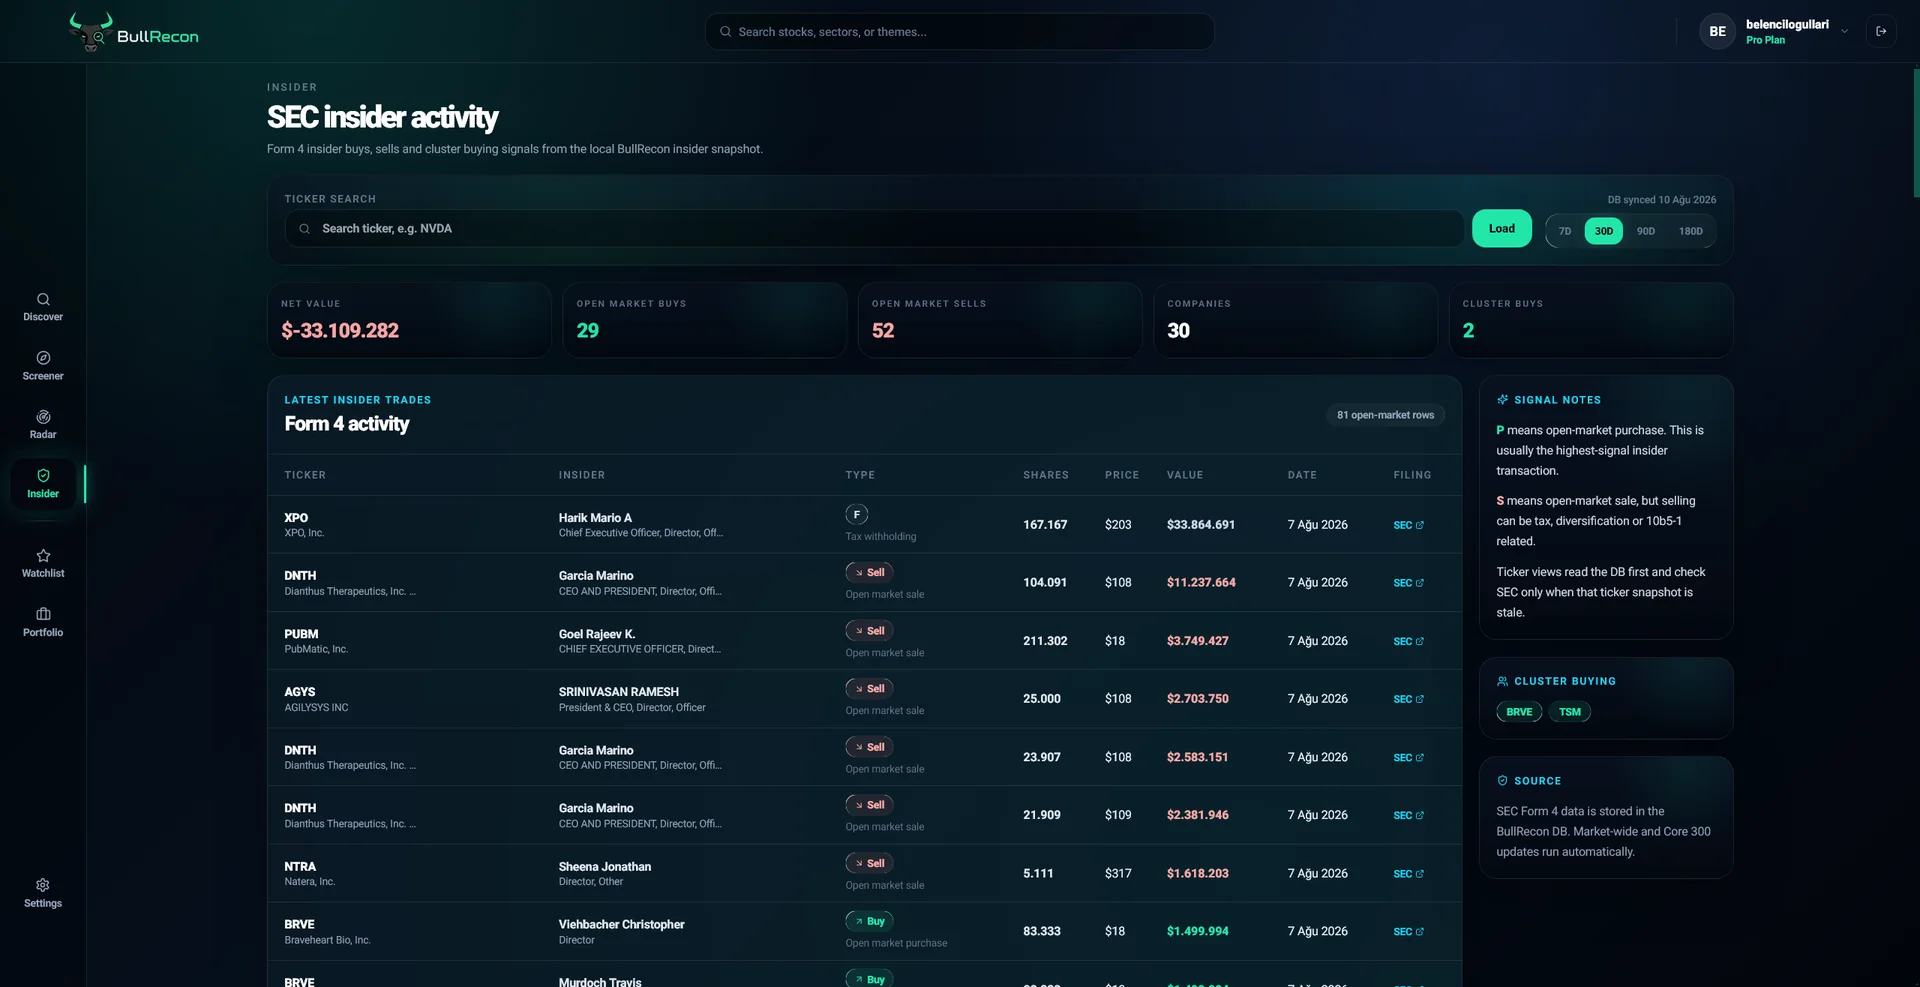 Earnings & OwnershipReports, insiders and institutional activity.
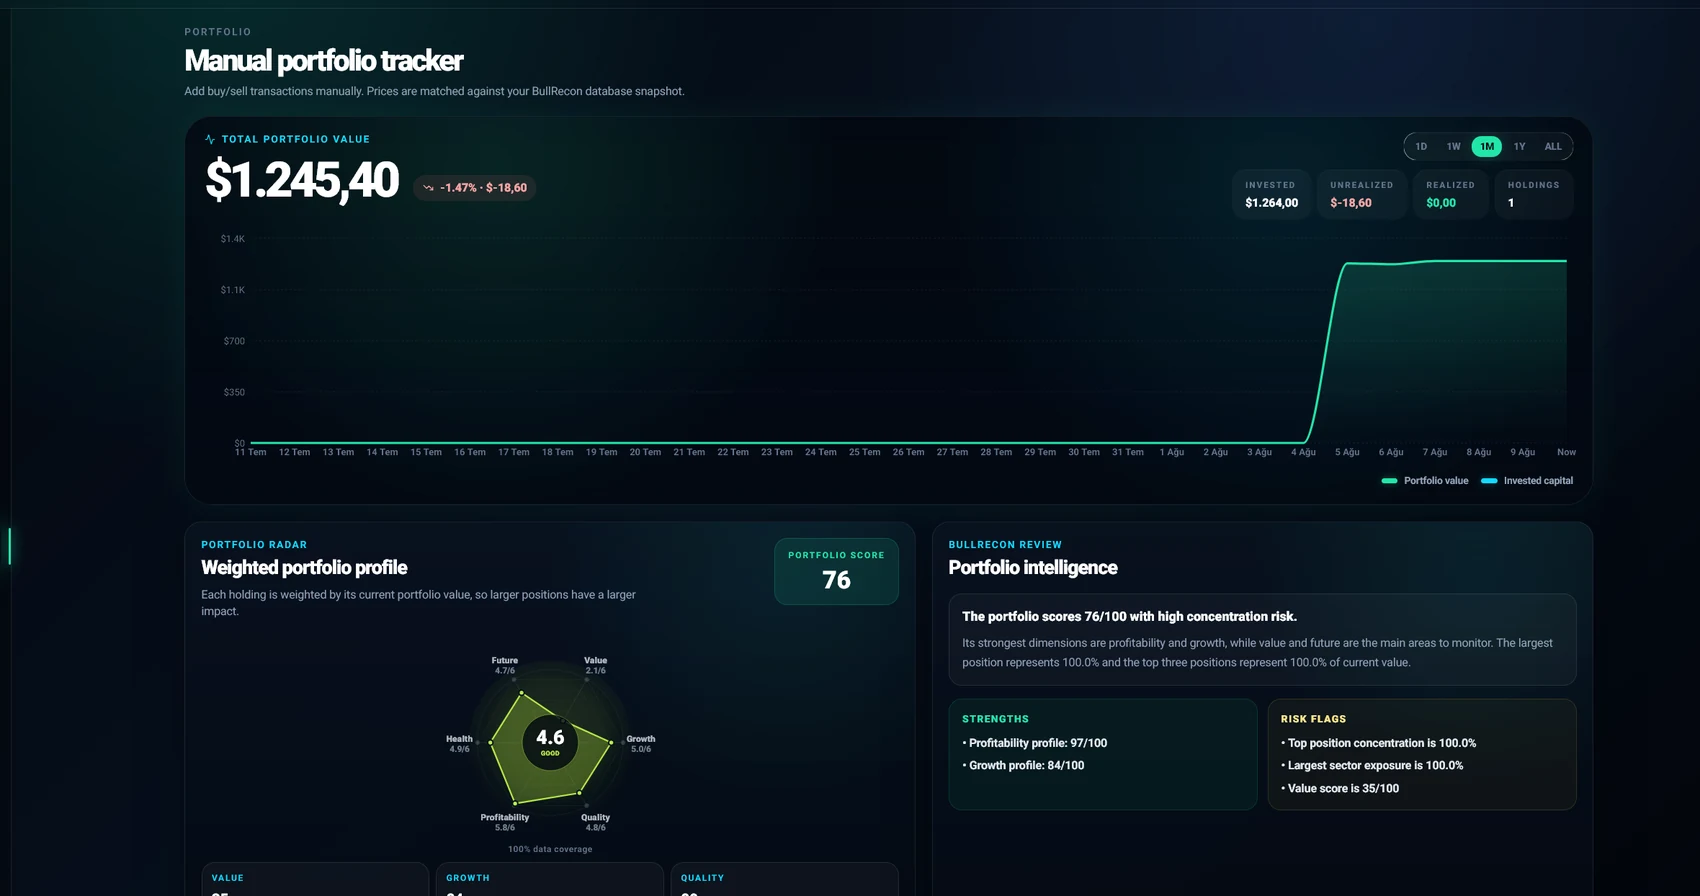 Market FlowCross-asset capital rotation and market regime.
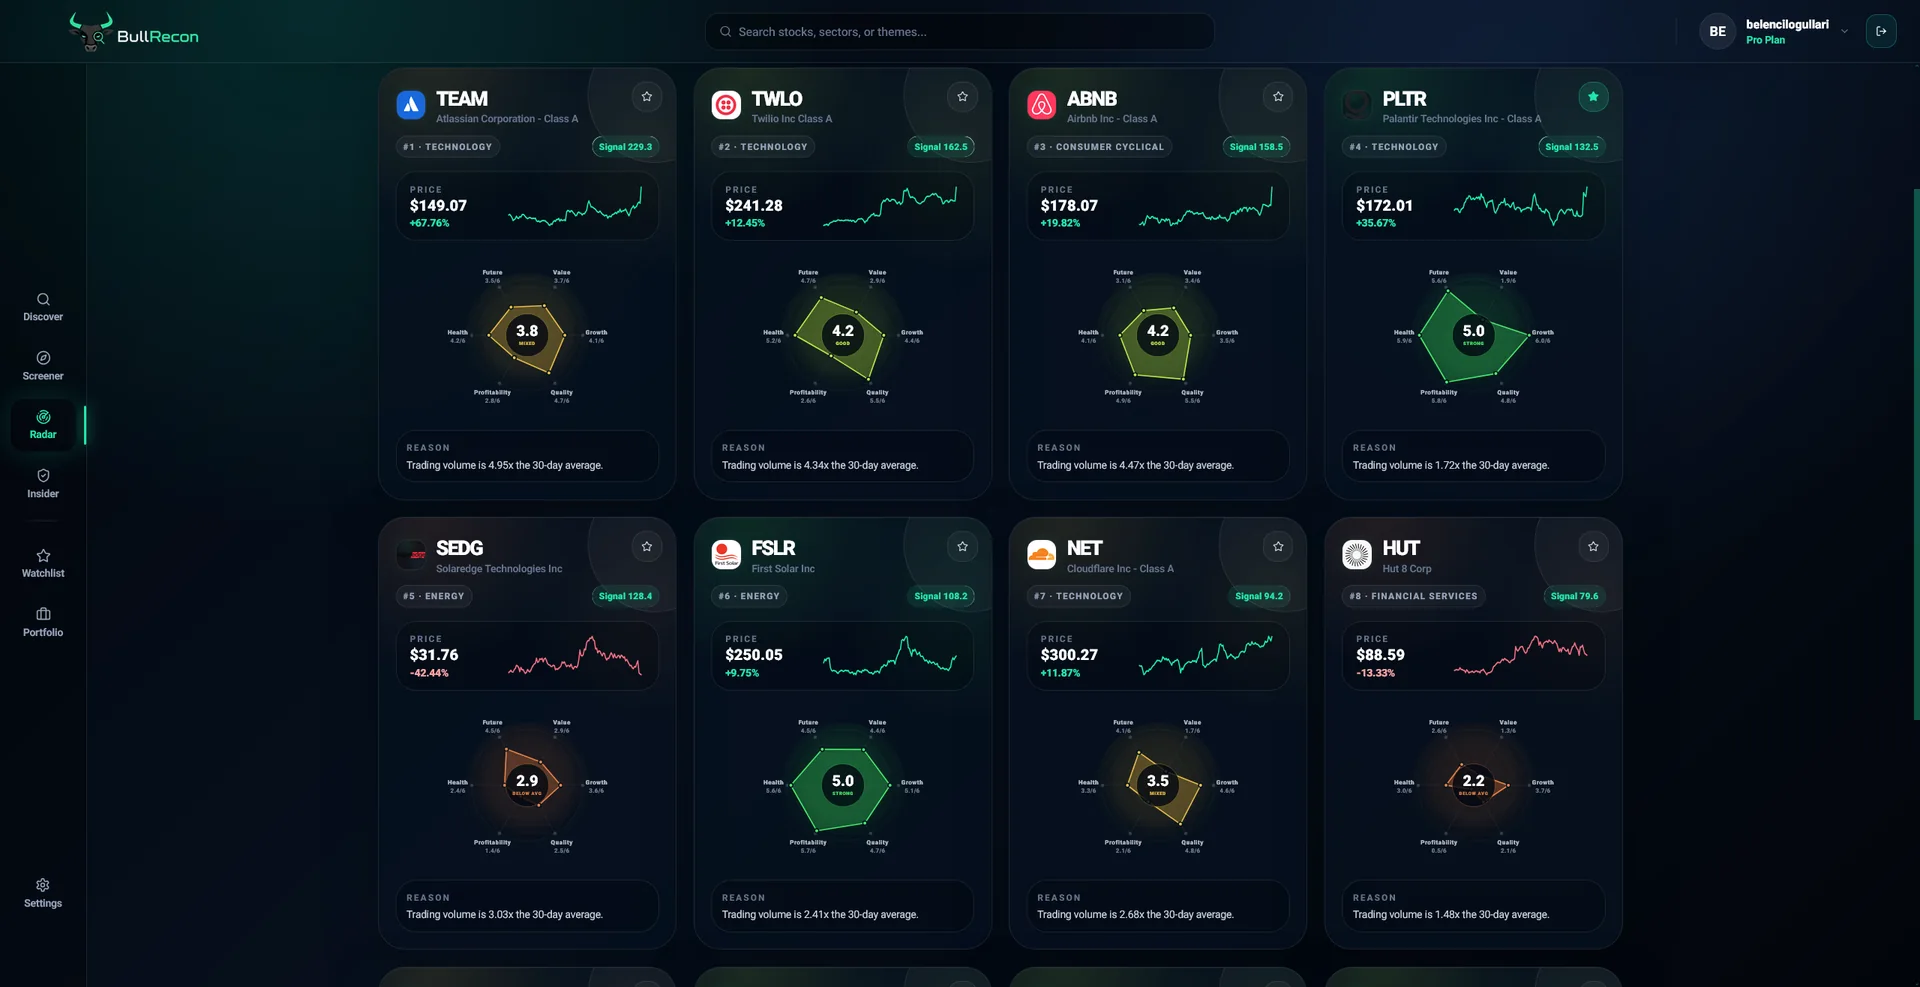 Daily RadarRanked opportunity lists refreshed from current market data.
 Stock ScreenerBuild a focused universe with presets and advanced filters.Stock DirectoryExplore supported US-listed companies and public reports.
 Analyst IntelligenceFollow source-verified calls and measured track records.Portfolio IntelligenceConnect performance, holdings and company context.
Features
Technical analysis
Flux EngineTrend, momentum and volume alignment.Pattern ReconChart and candlestick structures in context.Wyckoff ReconAccumulation and distribution phase mapping.BullRecon BeamRelative price position across an adaptive field.Fundamental analysis
Company RadarSix dimensions of business quality.Valuation & EntryFair value, support and long-term bands.Financials & Cash FlowRevenue, profit and cash generation.Earnings & OwnershipReports, insiders and institutional activity.Discover
Market FlowCross-asset capital rotation and market regime.Daily RadarRanked opportunity lists refreshed from current market data.Stock ScreenerBuild a focused universe with presets and advanced filters.Stock DirectoryExplore supported US-listed companies and public reports.Analyst IntelligenceFollow source-verified calls and measured track records.Portfolio IntelligenceConnect performance, holdings and company context.Cross-asset intelligenceClose · Nov 3, 2026
See how pressure is rotating across markets.
One visual reading of risk appetite, macro pressure and US sector leadership.
Market regime board
Price-action based rotation proxy · not reported fund flows
High confidenceNov 3, 2026
Sector rotation map
Leadership is moving across the sector field
73%
positive sectors
Leading
Real Estate
+2.90%
Health Care
+2.70%
Financials
+2.34%
Lagging
Technology
-6.85%
Energy
-2.24%
Communication Services
-2.07%
Risk appetite
Balanced
Proxy 56/100
Rate pressure
Moderate
Proxy 51/100
Inflation pressure proxy
Cooling
Proxy 35/100
Global rotation
Neutral
Proxy 51/100
Official macro tape
Reported US economic pressure
Source · US Bureau of Labor Statistics
Headline CPI
4.0%
Heating
September 2026
Core CPI
2.8%
Steady
September 2026
Producer prices
6.3%
Heating
September 2026
Unemployment
4.2%
Stable
September 2026
Nonfarm payrolls
+29K
Weak
September 2026
Wage growth
3.0%
Cooling
September 2026
Emerging sector rotation
Where momentum is building
Health Care
Emerging leader
79
Real Estate
Emerging leader
79
Consumer Staples
Emerging leader
75
Industrials
Emerging leader
75
Financials
Emerging leader
73
Consumer Discretionary
Emerging leader
71
A relative setup score from ETF trend, acceleration and volume participation—not a guaranteed forecast or reported fund flow.
Capital rotation evidence
What is leading beneath the index
Broad-market participation
Balanced
50
relative score
Small-cap participation
Balanced
50
relative score
Credit risk appetite
Balanced
48
relative score
Momentum leadership
Balanced
50
relative score
Quality leadership
Balanced
50
relative score
Value leadership
Balanced
50
relative score
Low-volatility demand
Balanced
50
relative score
Explore underlying market data+
Sector rotation
Leadership and pressure
Leading
Real EstateXLRE
+2.90%
1M —
Health CareXLV
+2.70%
1M —
FinancialsXLF
+2.34%
1M —
Lagging
TechnologyXLK
-6.85%
1M —
EnergyXLE
-2.24%
1M —
Communication ServicesXLC
-2.07%
1M —
Cross-asset map
One-week and one-month movement
Equities
Nasdaq-100NDX
-4.38%
1M -9.93%
US Small CapsIWM
-0.14%
1M -0.55%
Rates
Short TreasuriesSHY
-0.04%
1M +0.35%
Intermediate TreasuriesIEF
+0.14%
1M +2.29%
Long TreasuriesTLT
-0.52%
1M +5.04%
Inflation-Protected TreasuriesTIP
-0.20%
1M +1.84%
Credit
High-Yield CreditHYG
-0.80%
1M -0.38%
Investment-Grade CreditLQD
-0.56%
1M +1.55%
Currency
US DollarUUP
-0.38%
1M +0.38%
Real assets
GoldGLD
-3.50%
1M -6.02%
OilUSO
-3.48%
1M +9.15%
Global
Developed Markets ex-USEFA
-0.49%
1M -1.09%
Emerging MarketsEEM
-2.27%
1M -10.50%
Market breadth
Equal-Weight S&P 500RSP
+0.80%
1M +3.26%
Style factors
Momentum factorMTUM
-7.08%
1M -14.21%
Quality factorQUAL
-0.57%
1M -2.01%
Value factorVLUE
-2.04%
1M -3.77%
Low-volatility factorUSMV
-0.32%
1M +2.96%
How to read Market Flow
The engine describes observed market relationships. It does not identify individual buyers or predict a guaranteed next move.
Relative, not absolute
Leadership is measured against relevant benchmarks so a rising asset can still be losing relative strength.
Multiple confirmations
Equities, credit, rates, currencies and sectors must agree before the engine assigns a stronger regime.
End-of-day context
Readings use cached market-close data and are not presented as a real-time trading signal.
Transparent uncertainty
Coverage and confidence remain visible; missing data is not replaced with invented estimates.