01
Start with alignment
A pattern has more context when trend, momentum and participation support the same interpretation.




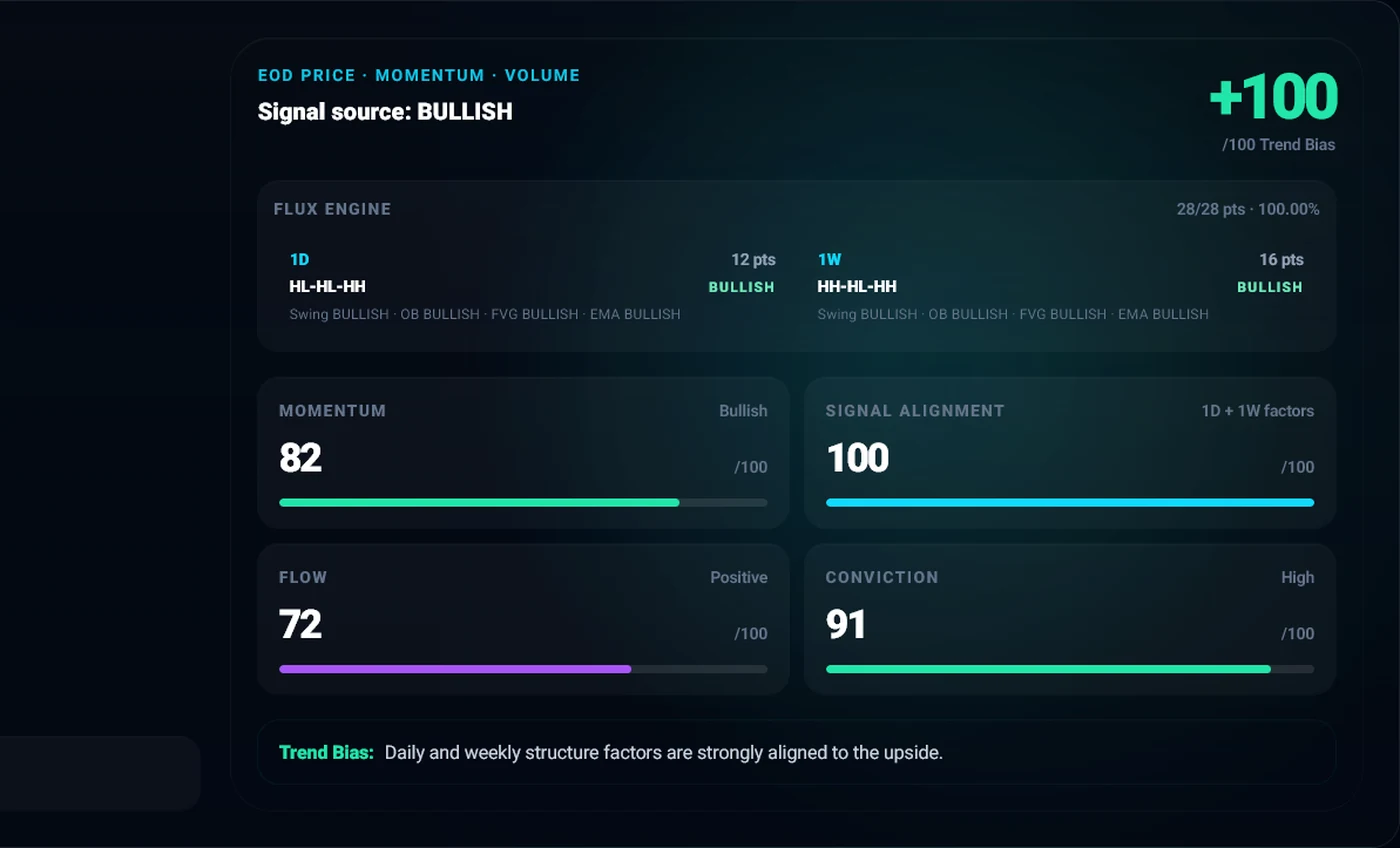 Flux EngineTrend, momentum and volume alignment.
 Pattern ReconChart and candlestick structures in context.
 Wyckoff ReconAccumulation and distribution phase mapping.
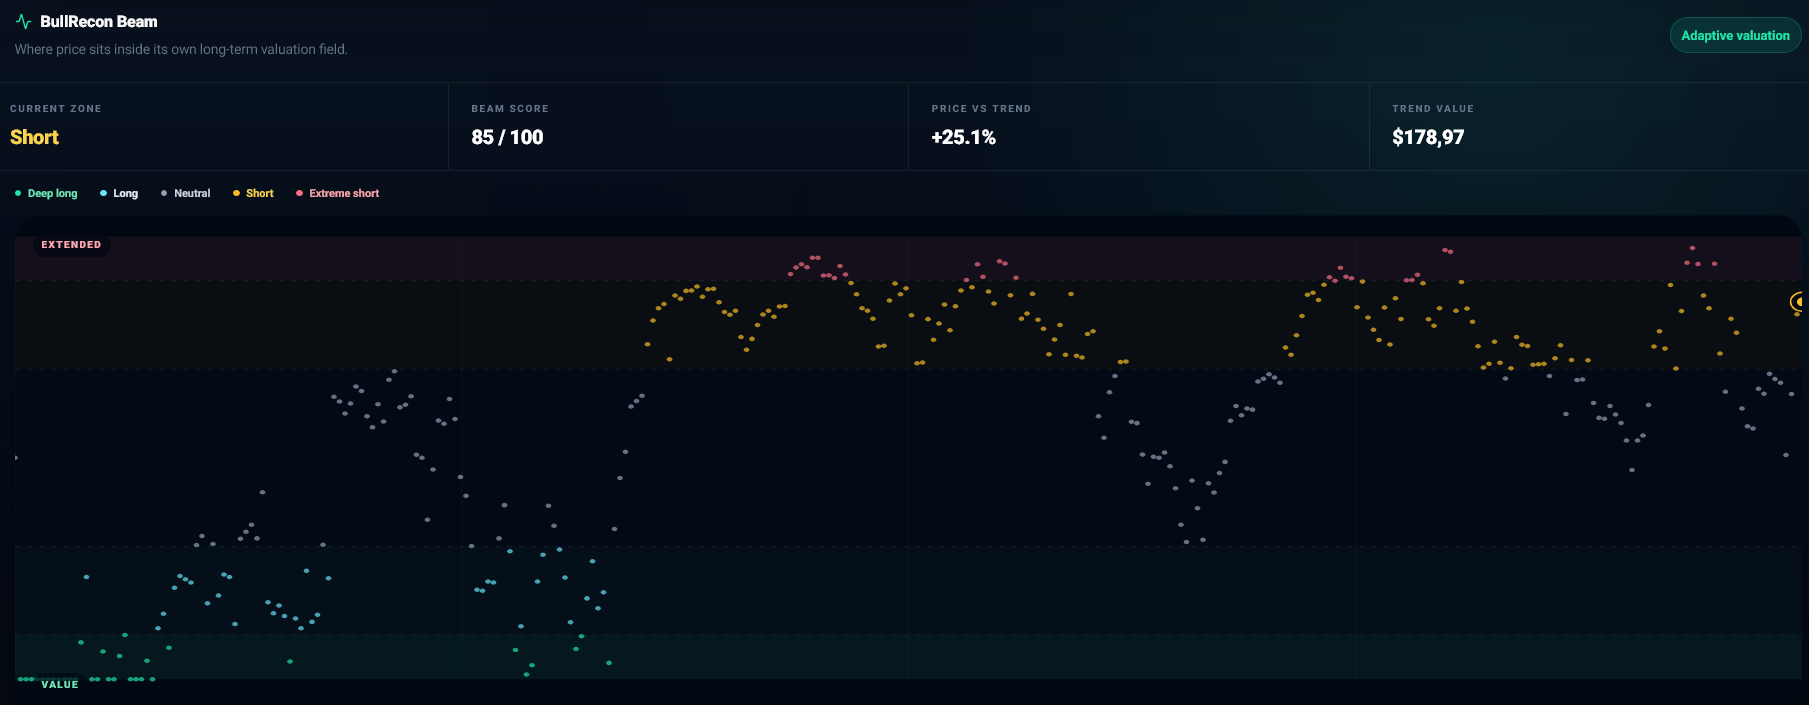 BullRecon BeamRelative price position across an adaptive field.
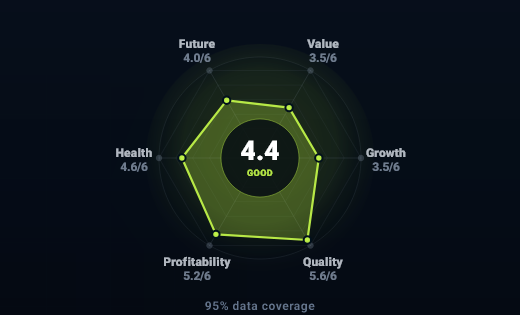 Company RadarSix dimensions of business quality.
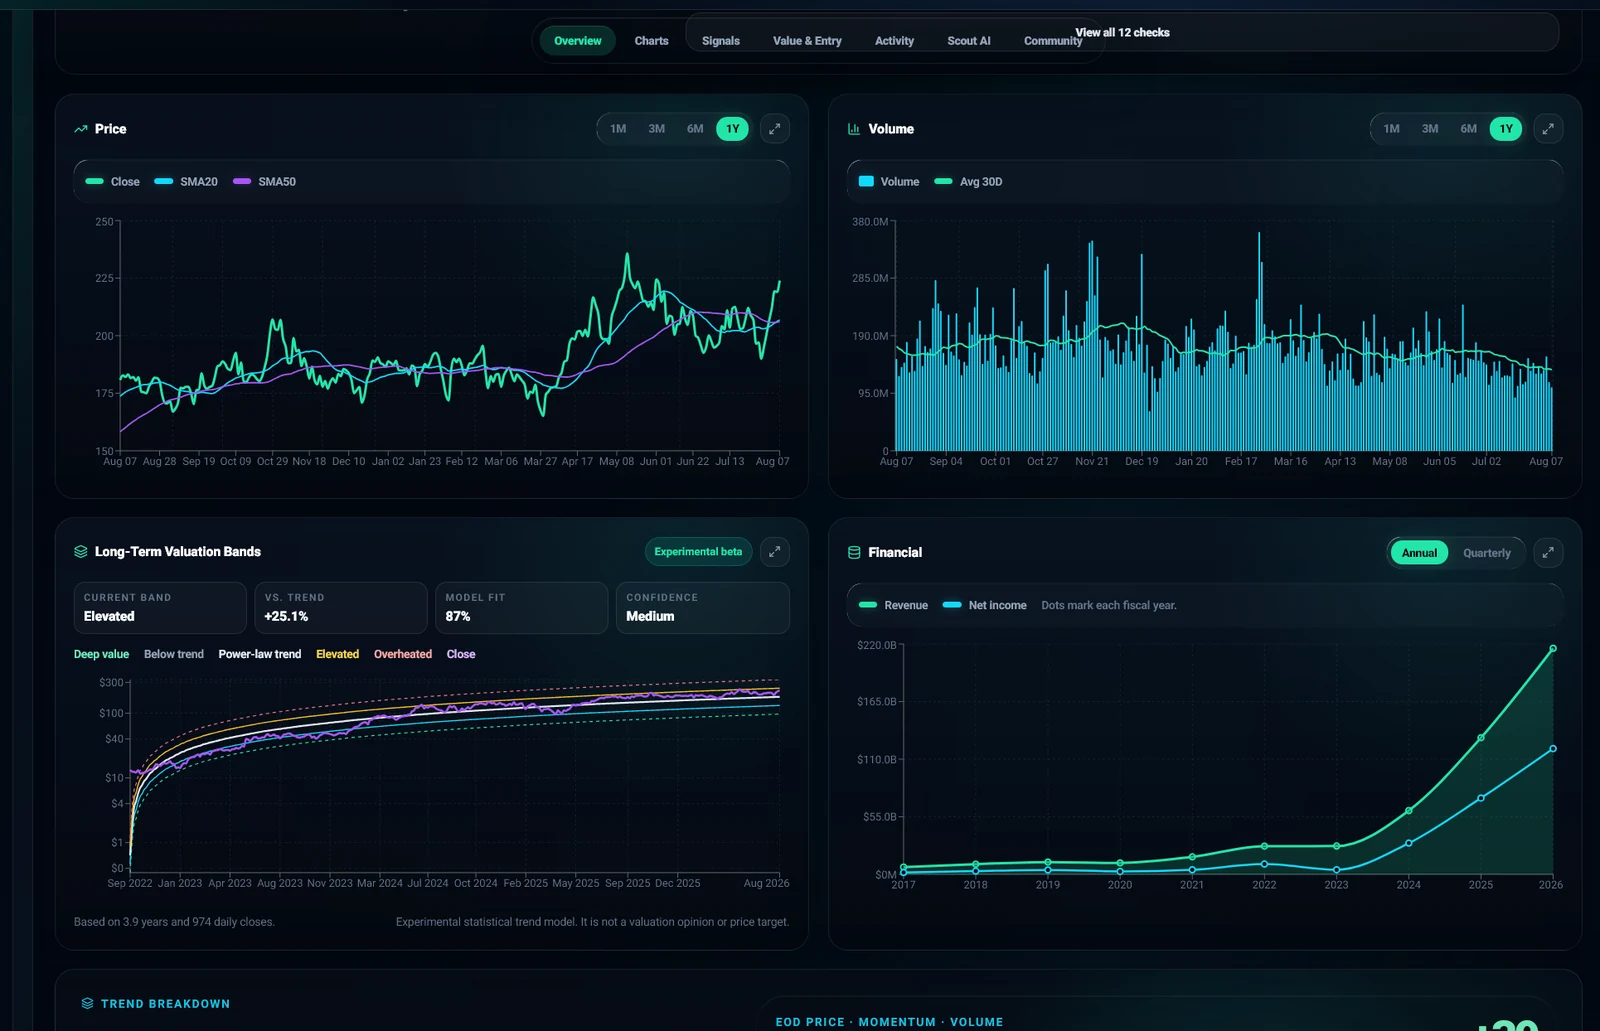
 Valuation & EntryFair value, support and long-term bands.
 Financials & Cash FlowRevenue, profit and cash generation.
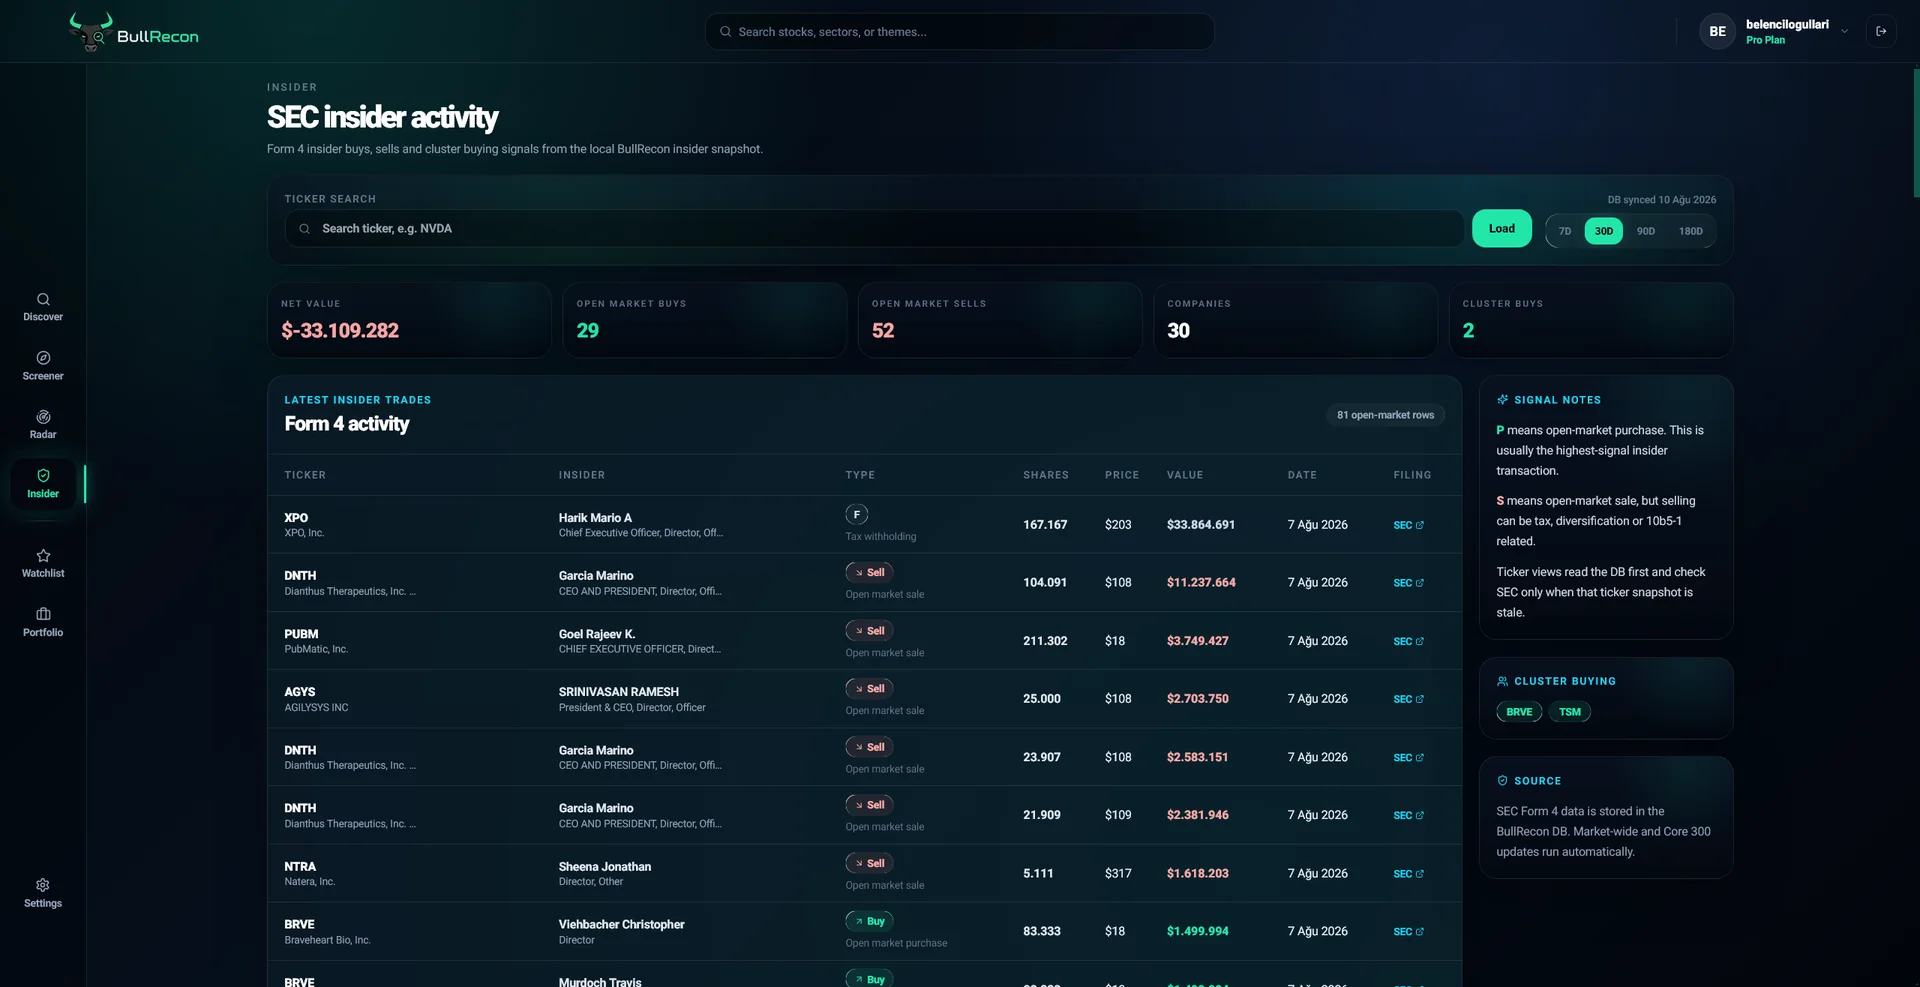 Earnings & OwnershipReports, insiders and institutional activity.
 Market FlowCross-asset capital rotation and market regime.
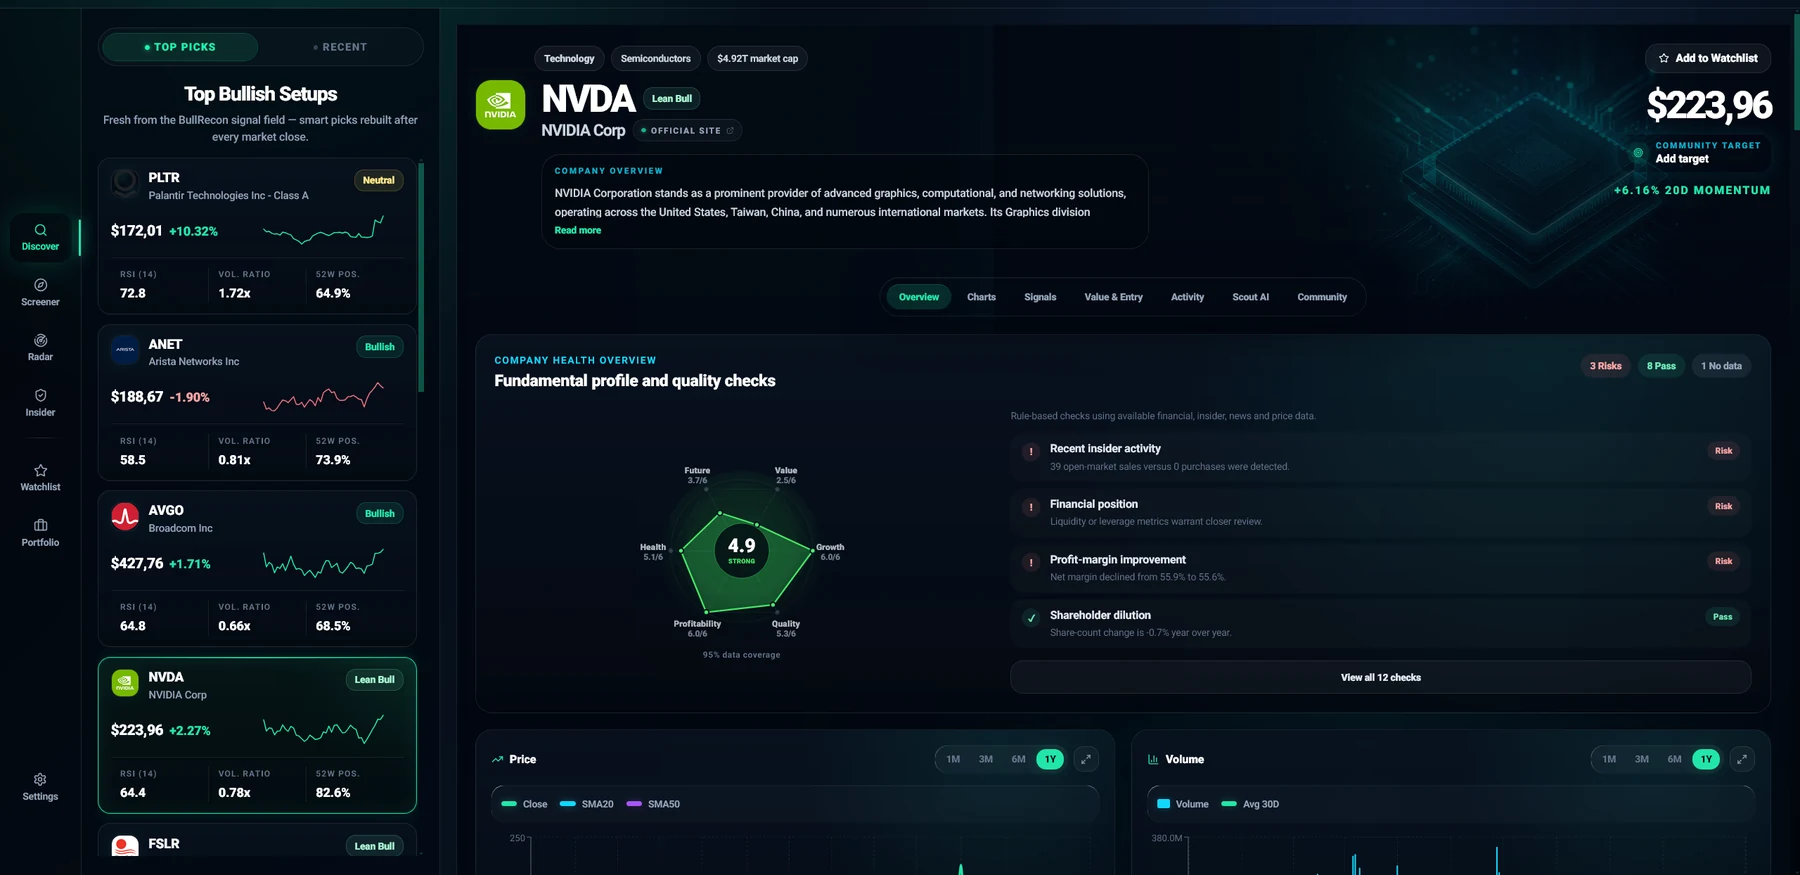
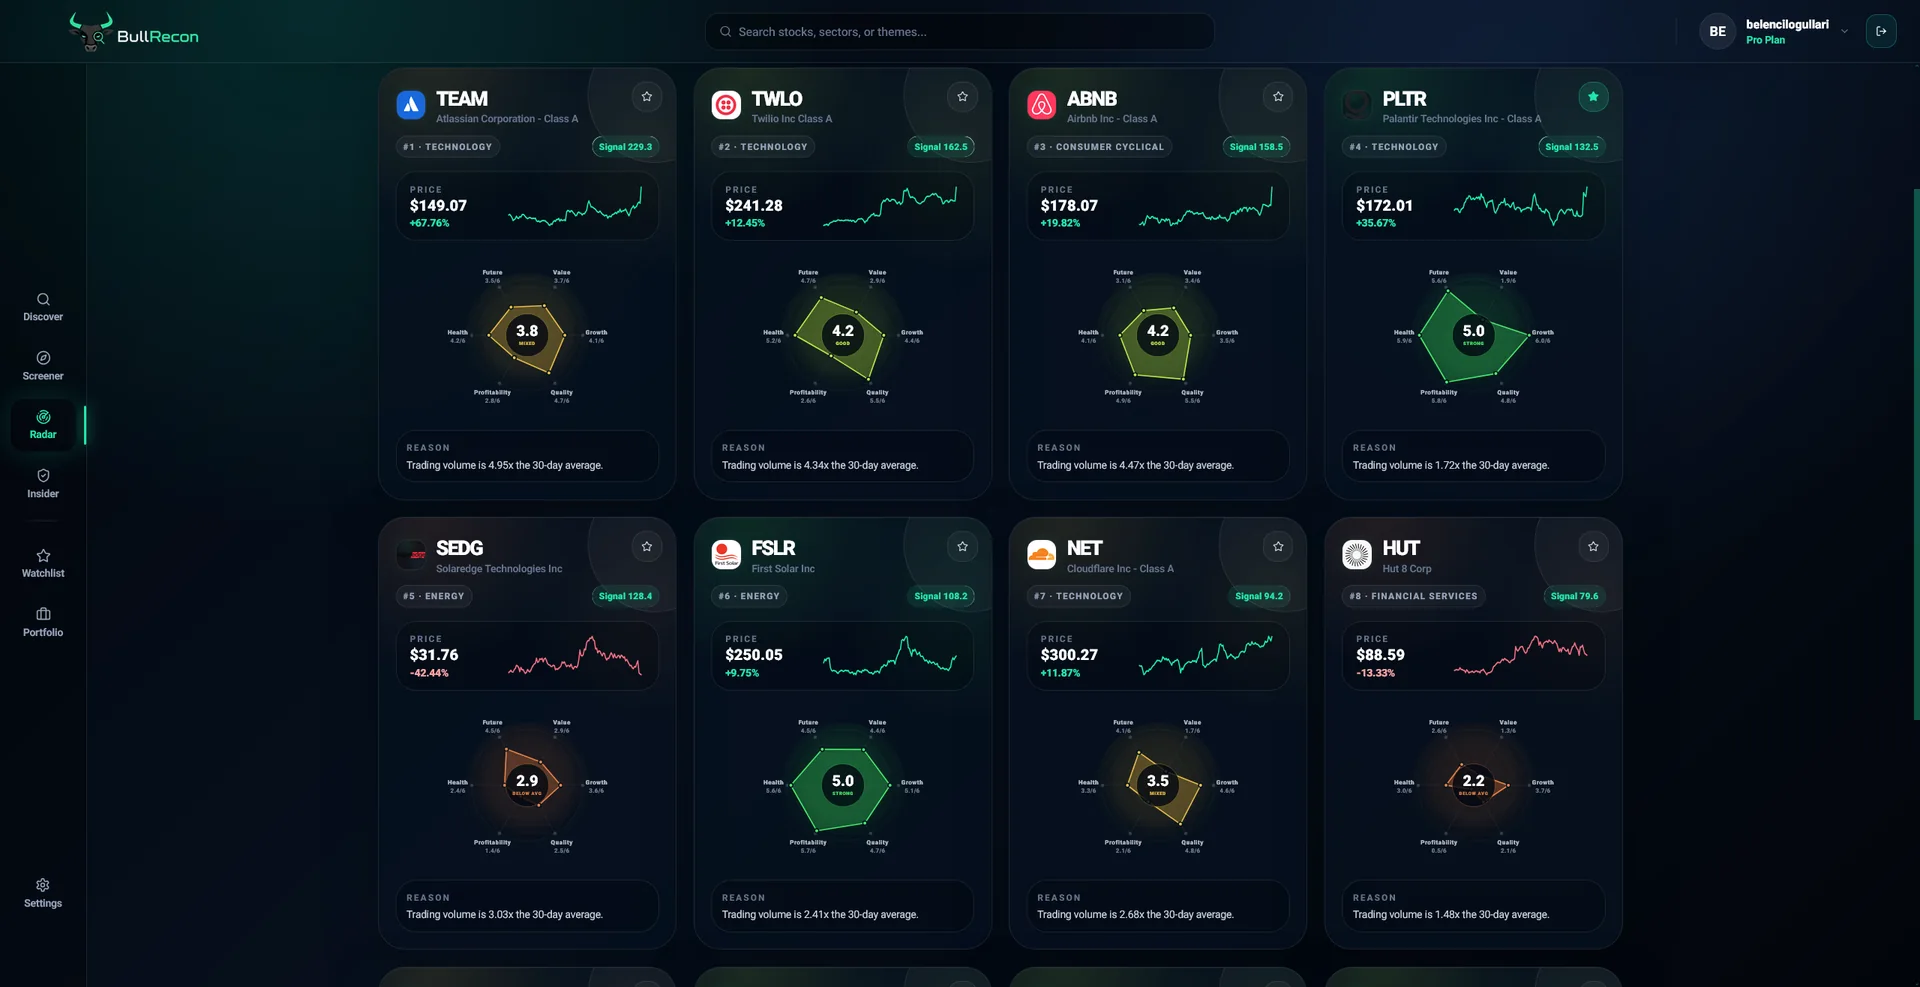 Daily RadarRanked opportunity lists refreshed from current market data.
 Stock ScreenerBuild a focused universe with presets and advanced filters.Stock DirectoryExplore supported US-listed companies and public reports.
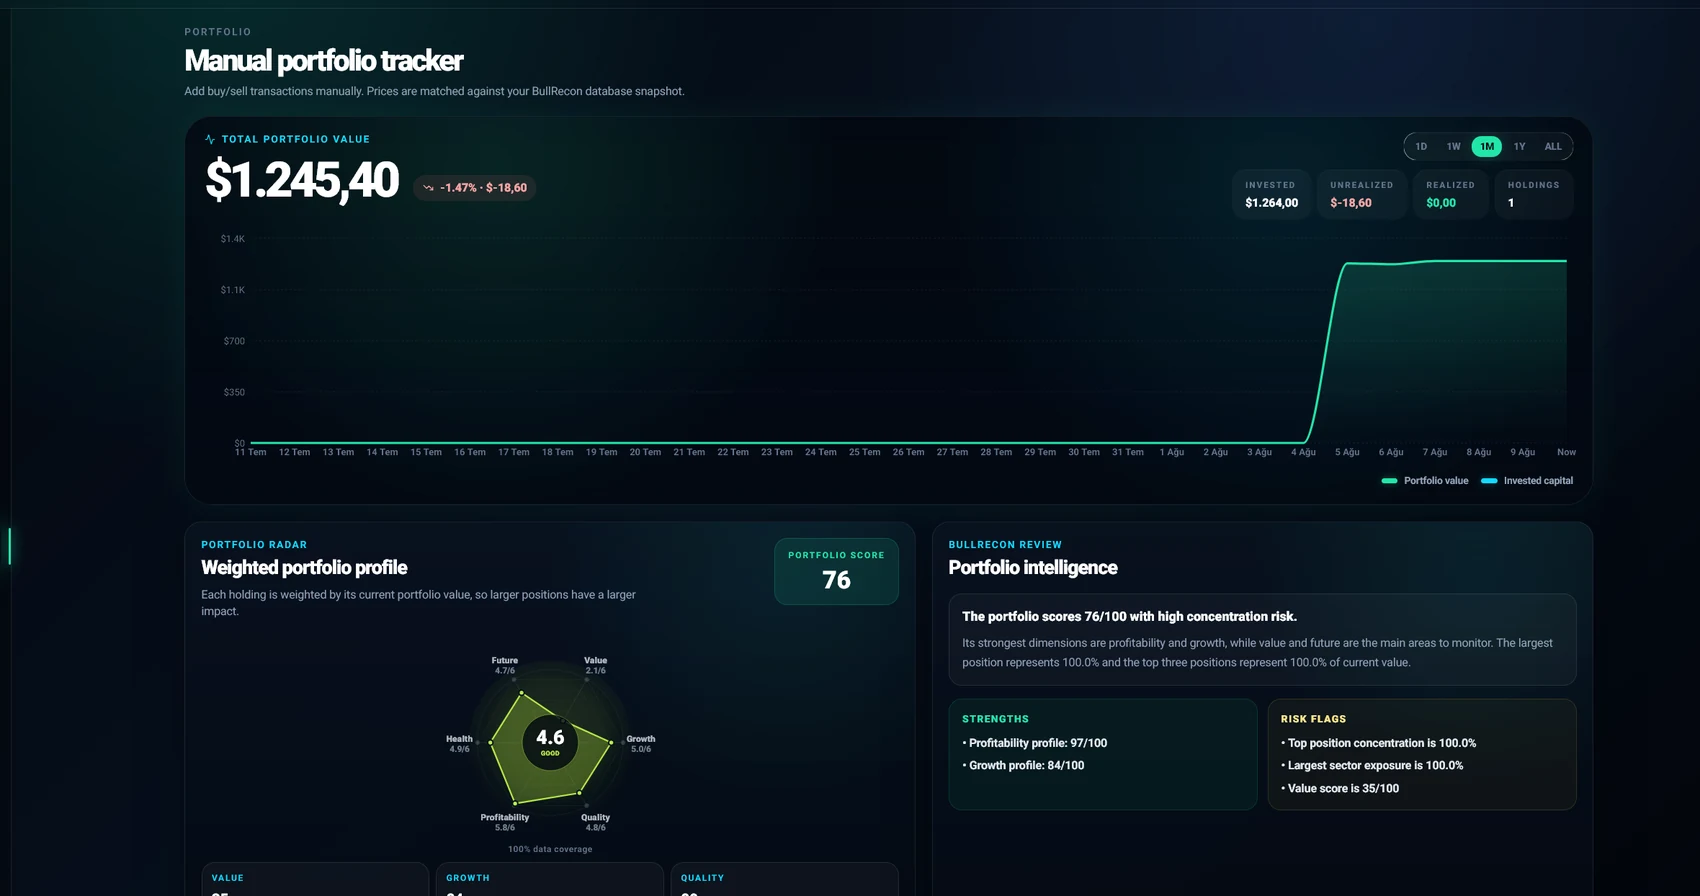
 Analyst IntelligenceFollow source-verified calls and measured track records.Portfolio IntelligenceConnect performance, holdings and company context.
BullRecon connects trend, momentum, volume, chart structures, candlestick patterns and Wyckoff context so one attractive signal is never mistaken for the whole setup.
Flux combines daily and weekly market structure with momentum and volume context. The result is an explainable directional read, not a standalone instruction to buy or sell.
BullRecon scans stored daily price history for chart and candlestick structures, distinguishes early candidates from confirmed patterns, and keeps invalidated setups visible in their proper historical context.
Wyckoff Recon evaluates price and volume behavior for accumulation and distribution characteristics, then places detected events directly over the underlying price history.
The Beam and Momentum Zones place current price inside an adaptive relative range. Labels describe extension and pressure while avoiding the false certainty of declaring an immediate reversal.
A pattern has more context when trend, momentum and participation support the same interpretation.
Candidates remain distinct from confirmed and completed signals so early formations are not presented as finished evidence.
Failed structures matter. BullRecon preserves invalidated outcomes instead of showing only the signals that worked.
No. Technical labels describe observed structure and conditions. They are research inputs, not personalized investment advice or automatic trade instructions.
The technical layer primarily uses daily price history and also incorporates weekly trend context where relevant. Each module explains the window it evaluates.
Confirmed historical patterns are evaluated over defined forward windows. Candidate and invalidated patterns are not silently counted as successful outcomes.
Yes. Relative-position labels describe where price is inside its current range; they do not predict that price must reverse immediately.